Comerica Stock: A Deep Dive Into Analyst Perspectives (21 Ratings)
Providing a diverse range of perspectives from bullish to bearish, 21 analysts have published ratings on Comerica (NYSE:CMA) in the last three months.
The following table encapsulates their recent ratings, offering a glimpse into the evolving sentiments over the past 30 days and comparing them to the preceding months.
| Bullish | Somewhat Bullish | Indifferent | Somewhat Bearish | Bearish | |
|---|---|---|---|---|---|
| Total Ratings | 0 | 9 | 9 | 3 | 0 |
| Last 30D | 0 | 3 | 3 | 2 | 0 |
| 1M Ago | 0 | 1 | 3 | 1 | 0 |
| 2M Ago | 0 | 1 | 1 | 0 | 0 |
| 3M Ago | 0 | 4 | 2 | 0 | 0 |
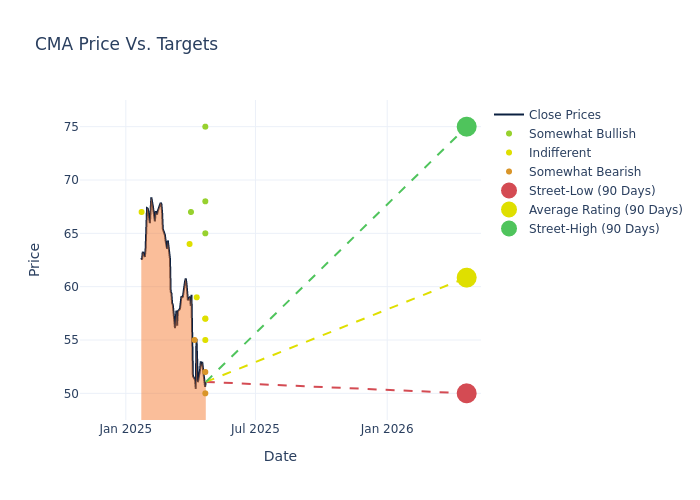
Analysts have set 12-month price targets for Comerica, revealing an average target of $65.33, a high estimate of $80.00, and a low estimate of $50.00. Highlighting a 8.95% decrease, the current average has fallen from the previous average price target of $71.75.
Investigating Analyst Ratings: An Elaborate Study
A clear picture of Comerica's perception among financial experts is painted with a thorough analysis of recent analyst actions. The summary below outlines key analysts, their recent evaluations, and adjustments to ratings and price targets.
| Analyst | Analyst Firm | Action Taken | Rating |Current Price Target| Prior Price Target | |--------------------|-----------------------|---------------|---------------|--------------------|--------------------| |Brandon King |Truist Securities |Lowers |Hold | $57.00|$65.00 | |Ryan Nash |Goldman Sachs |Lowers |Neutral | $57.00|$66.00 | |Karl Shepard |RBC Capital |Lowers |Outperform | $65.00|$75.00 | |Christopher Mcgratty|Keefe, Bruyette & Woods|Lowers |Outperform | $68.00|$77.00 | |John Pancari |Evercore ISI Group |Lowers |Underperform | $50.00|$65.00 | |Mike Mayo |Wells Fargo |Lowers |Equal-Weight | $55.00|$67.00 | |David George |Baird |Lowers |Outperform | $75.00|$80.00 | |Anthony Elian |JP Morgan |Lowers |Underweight | $52.00|$64.00 | |Nicholas Holowko |UBS |Announces |Neutral | $59.00|- | |Manan Gosalia |Morgan Stanley |Lowers |Underweight | $55.00|$63.00 | |Michael Rose |Raymond James |Lowers |Outperform | $67.00|$72.00 | |Terry McEvoy |Stephens & Co. |Lowers |Equal-Weight | $64.00|$66.00 | |Mike Mayo |Wells Fargo |Lowers |Equal-Weight | $67.00|$70.00 | |Manan Gosalia |Morgan Stanley |Lowers |Equal-Weight | $63.00|$71.00 | |Terry McEvoy |Stephens & Co. |Maintains |Overweight | $72.00|$72.00 | |David George |Baird |Raises |Outperform | $80.00|$75.00 | |Manan Gosalia |Morgan Stanley |Lowers |Equal-Weight | $71.00|$76.00 | |Karl Shepard |RBC Capital |Lowers |Outperform | $76.00|$78.00 | |Peter Winter |DA Davidson |Lowers |Neutral | $67.00|$71.00 | |Christopher Mcgratty|Keefe, Bruyette & Woods|Lowers |Outperform | $77.00|$82.00 | |David George |Baird |Lowers |Outperform | $75.00|$80.00 |
Key Insights:
- Action Taken: In response to dynamic market conditions and company performance, analysts update their recommendations. Whether they 'Maintain', 'Raise', or 'Lower' their stance, it signifies their reaction to recent developments related to Comerica. This insight gives a snapshot of analysts' perspectives on the current state of the company.
- Rating: Analysts unravel qualitative evaluations for stocks, ranging from 'Outperform' to 'Underperform'. These ratings offer insights into expectations for the relative performance of Comerica compared to the broader market.
- Price Targets: Gaining insights, analysts provide estimates for the future value of Comerica's stock. This comparison reveals trends in analysts' expectations over time.
Capture valuable insights into Comerica's market standing by understanding these analyst evaluations alongside pertinent financial indicators. Stay informed and make strategic decisions with our Ratings Table.
Stay up to date on Comerica analyst ratings.
About Comerica
With assets of around $80 billion, Comerica is primarily a relationship-based commercial bank headquartered in Dallas. In addition to Texas, Comerica's other primary geographies are California and Michigan, with locations also in Arizona and Florida and select businesses operating in several other states as well as Canada and Mexico.
Comerica: Delving into Financials
Market Capitalization Analysis: The company exhibits a lower market capitalization profile, positioning itself below industry averages. This suggests a smaller scale relative to peers.
Revenue Growth: Over the 3M period, Comerica showcased positive performance, achieving a revenue growth rate of 5.5% as of 31 December, 2024. This reflects a substantial increase in the company's top-line earnings. As compared to competitors, the company encountered difficulties, with a growth rate lower than the average among peers in the Financials sector.
Net Margin: The company's net margin is a standout performer, exceeding industry averages. With an impressive net margin of 19.76%, the company showcases strong profitability and effective cost control.
Return on Equity (ROE): The company's ROE is below industry benchmarks, signaling potential difficulties in efficiently using equity capital. With an ROE of 2.48%, the company may need to address challenges in generating satisfactory returns for shareholders.
Return on Assets (ROA): Comerica's ROA falls below industry averages, indicating challenges in efficiently utilizing assets. With an ROA of 0.21%, the company may face hurdles in generating optimal returns from its assets.
Debt Management: Comerica's debt-to-equity ratio is below the industry average at 1.09, reflecting a lower dependency on debt financing and a more conservative financial approach.
The Core of Analyst Ratings: What Every Investor Should Know
Benzinga tracks 150 analyst firms and reports on their stock expectations. Analysts typically arrive at their conclusions by predicting how much money a company will make in the future, usually the upcoming five years, and how risky or predictable that company's revenue streams are.
Analysts attend company conference calls and meetings, research company financial statements, and communicate with insiders to publish their ratings on stocks. Analysts typically rate each stock once per quarter or whenever the company has a major update.
Some analysts also offer predictions for helpful metrics such as earnings, revenue, and growth estimates to provide further guidance as to what to do with certain tickers. It is important to keep in mind that while stock and sector analysts are specialists, they are also human and can only forecast their beliefs to traders.
Breaking: Wall Street's Next Big Mover
Benzinga's #1 analyst just identified a stock poised for explosive growth. This under-the-radar company could surge 200%+ as major market shifts unfold. Click here for urgent details.
This article was generated by Benzinga's automated content engine and reviewed by an editor.