Insights Ahead: TruBridge's Quarterly Earnings
TruBridge (NASDAQ:TBRG) is set to give its latest quarterly earnings report on Wednesday, 2025-05-07. Here's what investors need to know before the announcement.
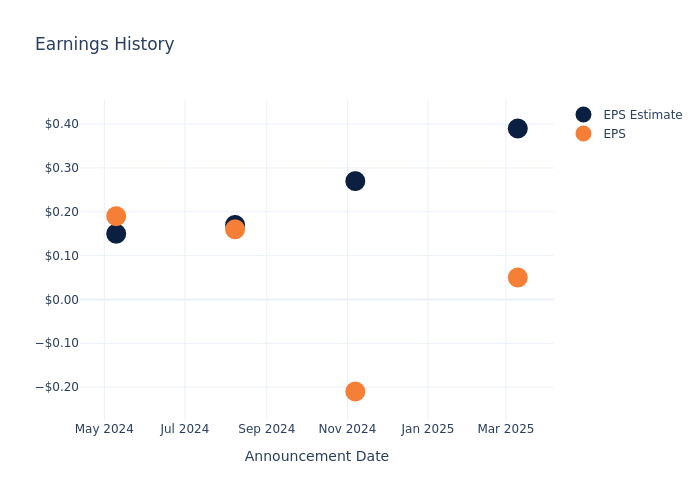
Analysts estimate that TruBridge will report an earnings per share (EPS) of $0.29.
The market awaits TruBridge's announcement, with hopes high for news of surpassing estimates and providing upbeat guidance for the next quarter.
It's important for new investors to understand that guidance can be a significant driver of stock prices.
Historical Earnings Performance
During the last quarter, the company reported an EPS missed by $0.34, leading to a 7.49% increase in the share price on the subsequent day.
Here's a look at TruBridge's past performance and the resulting price change:
| Quarter | Q4 2024 | Q3 2024 | Q2 2024 | Q1 2024 |
|---|---|---|---|---|
| EPS Estimate | 0.39 | 0.27 | 0.17 | 0.15 |
| EPS Actual | 0.05 | -0.21 | 0.16 | 0.19 |
| Price Change % | 7.000000000000001% | -0.0% | 24.0% | 4.0% |
Stock Performance
Shares of TruBridge were trading at $26.29 as of May 05. Over the last 52-week period, shares are up 211.12%. Given that these returns are generally positive, long-term shareholders are likely bullish going into this earnings release.
Analyst Opinions on TruBridge
Understanding market sentiments and expectations within the industry is crucial for investors. This analysis delves into the latest insights on TruBridge.
Analysts have given TruBridge a total of 3 ratings, with the consensus rating being Neutral. The average one-year price target is $28.33, indicating a potential 7.76% upside.
Comparing Ratings with Competitors
In this comparison, we explore the analyst ratings and average 1-year price targets of Claritev, Definitive Healthcare and Health Catalyst, three prominent industry players, offering insights into their relative performance expectations and market positioning.
- Analysts currently favor an Neutral trajectory for Claritev, with an average 1-year price target of $19.0, suggesting a potential 27.73% downside.
- Analysts currently favor an Neutral trajectory for Definitive Healthcare, with an average 1-year price target of $3.0, suggesting a potential 88.59% downside.
- Analysts currently favor an Neutral trajectory for Health Catalyst, with an average 1-year price target of $5.81, suggesting a potential 77.9% downside.
Key Findings: Peer Analysis Summary
The peer analysis summary outlines pivotal metrics for Claritev, Definitive Healthcare and Health Catalyst, demonstrating their respective standings within the industry and offering valuable insights into their market positions and comparative performance.
| Company | Consensus | Revenue Growth | Gross Profit | Return on Equity |
|---|---|---|---|---|
| TruBridge | Neutral | 10.26% | $49.78M | -1.72% |
| Claritev | Neutral | -4.91% | $175.01M | -94.63% |
| Definitive Healthcare | Neutral | -5.53% | $47.60M | -12.43% |
| Health Catalyst | Neutral | 6.02% | $34.69M | -5.74% |
Key Takeaway:
TruBridge ranks at the bottom for Revenue Growth and Gross Profit, while it ranks in the middle for Return on Equity.
Unveiling the Story Behind TruBridge
TruBridge Inc is a provider of healthcare solutions and services for community hospitals, clinics, and other healthcare systems. It provides services such as Electronic health records & information systems, revenue cycle management, population health, and data management, etc. The segments of the company are Revenue Cycle Management (RCM), (ii) Electronic Health Records (EHR), and (iii) Patient Engagement The company derives maximum revenue from the RCM segment.
TruBridge: A Financial Overview
Market Capitalization Analysis: Falling below industry benchmarks, the company's market capitalization reflects a reduced size compared to peers. This positioning may be influenced by factors such as growth expectations or operational capacity.
Revenue Growth: TruBridge displayed positive results in 3 months. As of 31 December, 2024, the company achieved a solid revenue growth rate of approximately 10.26%. This indicates a notable increase in the company's top-line earnings. When compared to others in the Health Care sector, the company faces challenges, achieving a growth rate lower than the average among peers.
Net Margin: TruBridge's financial strength is reflected in its exceptional net margin, which exceeds industry averages. With a remarkable net margin of -3.23%, the company showcases strong profitability and effective cost management.
Return on Equity (ROE): TruBridge's financial strength is reflected in its exceptional ROE, which exceeds industry averages. With a remarkable ROE of -1.72%, the company showcases efficient use of equity capital and strong financial health.
Return on Assets (ROA): TruBridge's ROA surpasses industry standards, highlighting the company's exceptional financial performance. With an impressive -0.74% ROA, the company effectively utilizes its assets for optimal returns.
Debt Management: The company maintains a balanced debt approach with a debt-to-equity ratio below industry norms, standing at 1.04.
To track all earnings releases for TruBridge visit their earnings calendar on our site.
This article was generated by Benzinga's automated content engine and reviewed by an editor.