Breaking Down Macy's: 12 Analysts Share Their Views
In the preceding three months, 12 analysts have released ratings for Macy's (NYSE:M), presenting a wide array of perspectives from bullish to bearish.
Summarizing their recent assessments, the table below illustrates the evolving sentiments in the past 30 days and compares them to the preceding months.
| Bullish | Somewhat Bullish | Indifferent | Somewhat Bearish | Bearish | |
|---|---|---|---|---|---|
| Total Ratings | 1 | 0 | 10 | 0 | 1 |
| Last 30D | 0 | 0 | 1 | 0 | 0 |
| 1M Ago | 0 | 0 | 1 | 0 | 0 |
| 2M Ago | 0 | 0 | 5 | 0 | 0 |
| 3M Ago | 1 | 0 | 3 | 0 | 1 |
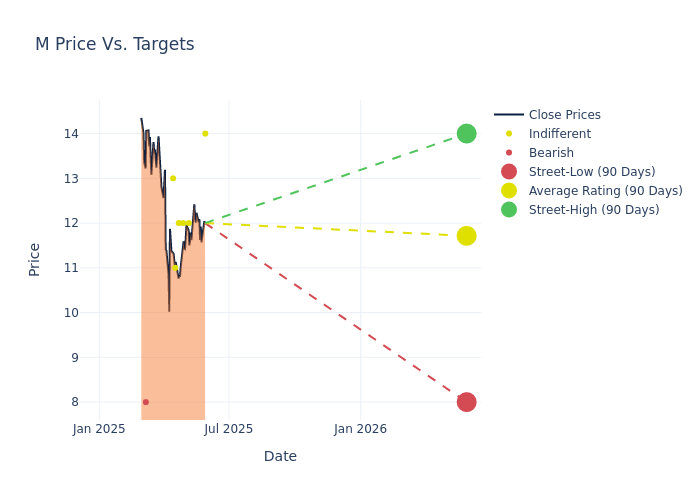
In the assessment of 12-month price targets, analysts unveil insights for Macy's, presenting an average target of $13.33, a high estimate of $17.00, and a low estimate of $8.00. Experiencing a 12.19% decline, the current average is now lower than the previous average price target of $15.18.
Deciphering Analyst Ratings: An In-Depth Analysis
An in-depth analysis of recent analyst actions unveils how financial experts perceive Macy's. The following summary outlines key analysts, their recent evaluations, and adjustments to ratings and price targets.
| Analyst | Analyst Firm | Action Taken | Rating | Current Price Target | Prior Price Target |
|---|---|---|---|---|---|
| Dana Telsey | Telsey Advisory Group | Lowers | Market Perform | $14.00 | $15.00 |
| Alex Straton | Morgan Stanley | Lowers | Equal-Weight | $12.00 | $14.00 |
| Paul Kearney | Barclays | Announces | Equal-Weight | $12.00 | - |
| Brooke Roach | Goldman Sachs | Lowers | Neutral | $12.00 | $17.00 |
| Paul Lejuez | Citigroup | Lowers | Neutral | $11.00 | $14.00 |
| Matthew Boss | JP Morgan | Lowers | Neutral | $13.00 | $14.00 |
| Dana Telsey | Telsey Advisory Group | Maintains | Market Perform | $15.00 | $15.00 |
| Paul Lejuez | Citigroup | Lowers | Neutral | $14.00 | $16.00 |
| Brooke Roach | Goldman Sachs | Lowers | Buy | $17.00 | $19.00 |
| Jay Sole | UBS | Lowers | Sell | $8.00 | $9.00 |
| Dana Telsey | Telsey Advisory Group | Lowers | Market Perform | $15.00 | $17.00 |
| Dana Telsey | Telsey Advisory Group | Maintains | Market Perform | $17.00 | $17.00 |
Key Insights:
- Action Taken: Analysts frequently update their recommendations based on evolving market conditions and company performance. Whether they 'Maintain', 'Raise' or 'Lower' their stance, it reflects their reaction to recent developments related to Macy's. This information provides a snapshot of how analysts perceive the current state of the company.
- Rating: Analysts assign qualitative assessments to stocks, ranging from 'Outperform' to 'Underperform'. These ratings convey the analysts' expectations for the relative performance of Macy's compared to the broader market.
- Price Targets: Analysts navigate through adjustments in price targets, providing estimates for Macy's's future value. Comparing current and prior targets offers insights into analysts' evolving expectations.
Considering these analyst evaluations in conjunction with other financial indicators can offer a comprehensive understanding of Macy's's market position. Stay informed and make well-informed decisions with our Ratings Table.
Stay up to date on Macy's analyst ratings.
Unveiling the Story Behind Macy's
Founded in 1858 and based in New York City, Macy's operates about 450 stores under the Macy's nameplate, nearly 60 stores under the Bloomingdale's (full-price and outlet) and Bloomie's nameplates, and more than 170 freestanding Bluemercury specialty beauty stores. Macy's also operates e-commerce sites and licenses Bloomingdale's stores in the United Arab Emirates and Kuwait. Women's apparel, accessories, shoes, cosmetics, and fragrances constitute about 62% of Macy's sales.
Macy's's Financial Performance
Market Capitalization Perspectives: The company's market capitalization falls below industry averages, signaling a relatively smaller size compared to peers. This positioning may be influenced by factors such as perceived growth potential or operational scale.
Revenue Challenges: Macy's's revenue growth over 3M faced difficulties. As of 31 January, 2025, the company experienced a decline of approximately -4.39%. This indicates a decrease in top-line earnings. In comparison to its industry peers, the company trails behind with a growth rate lower than the average among peers in the Consumer Discretionary sector.
Net Margin: The company's net margin is a standout performer, exceeding industry averages. With an impressive net margin of 4.27%, the company showcases strong profitability and effective cost control.
Return on Equity (ROE): The company's ROE is a standout performer, exceeding industry averages. With an impressive ROE of 7.86%, the company showcases effective utilization of equity capital.
Return on Assets (ROA): Macy's's ROA excels beyond industry benchmarks, reaching 2.03%. This signifies efficient management of assets and strong financial health.
Debt Management: Macy's's debt-to-equity ratio is notably higher than the industry average. With a ratio of 1.25, the company relies more heavily on borrowed funds, indicating a higher level of financial risk.
How Are Analyst Ratings Determined?
Benzinga tracks 150 analyst firms and reports on their stock expectations. Analysts typically arrive at their conclusions by predicting how much money a company will make in the future, usually the upcoming five years, and how risky or predictable that company's revenue streams are.
Analysts attend company conference calls and meetings, research company financial statements, and communicate with insiders to publish their ratings on stocks. Analysts typically rate each stock once per quarter or whenever the company has a major update.
Analysts may supplement their ratings with predictions for metrics like growth estimates, earnings, and revenue, offering investors a more comprehensive outlook. However, investors should be mindful that analysts, like any human, can have subjective perspectives influencing their forecasts.
Breaking: Wall Street's Next Big Mover
Benzinga's #1 analyst just identified a stock poised for explosive growth. This under-the-radar company could surge 200%+ as major market shifts unfold. Click here for urgent details.
This article was generated by Benzinga's automated content engine and reviewed by an editor.