Understanding NVIDIA's Position In Semiconductors & Semiconductor Equipment Industry Compared To Competitors
In today's rapidly changing and fiercely competitive business landscape, it is essential for investors and industry enthusiasts to thoroughly analyze companies. In this article, we will conduct a comprehensive industry comparison, evaluating NVIDIA (NASDAQ:NVDA) against its key competitors in the Semiconductors & Semiconductor Equipment industry. By examining key financial metrics, market position, and growth prospects, we aim to provide valuable insights for investors and shed light on company's performance within the industry.
NVIDIA Background
Nvidia is a leading developer of graphics processing units. Traditionally, GPUs were used to enhance the experience on computing platforms, most notably in gaming applications on PCs. GPU use cases have since emerged as important semiconductors used in artificial intelligence. Nvidia not only offers AI GPUs, but also a software platform, Cuda, used for AI model development and training. Nvidia is also expanding its data center networking solutions, helping to tie GPUs together to handle complex workloads.
| Company | P/E | P/B | P/S | ROE | EBITDA (in billions) | Gross Profit (in billions) | Revenue Growth |
|---|---|---|---|---|---|---|---|
| NVIDIA Corp | 45.16 | 40.72 | 23.31 | 23.01% | $22.58 | $26.67 | 69.18% |
| Broadcom Inc | 94.80 | 17.56 | 22 | 8.01% | $8.54 | $10.14 | 24.71% |
| Taiwan Semiconductor Manufacturing Co Ltd | 24.44 | 6.93 | 10.07 | 8.19% | $608.71 | $493.4 | 41.61% |
| Advanced Micro Devices Inc | 84.45 | 3.24 | 6.81 | 1.23% | $1.59 | $3.74 | 35.9% |
| Texas Instruments Inc | 36.08 | 10.55 | 10.90 | 7.08% | $1.85 | $2.31 | 11.14% |
| Qualcomm Inc | 15.06 | 5.84 | 3.92 | 10.3% | $3.67 | $6.04 | 16.93% |
| ARM Holdings PLC | 172.73 | 20.07 | 34.37 | 3.17% | $0.46 | $1.21 | 33.73% |
| Micron Technology Inc | 25.43 | 2.44 | 3.83 | 3.32% | $3.95 | $2.96 | 38.27% |
| Analog Devices Inc | 59.25 | 3.09 | 11.07 | 1.63% | $1.2 | $1.61 | 22.28% |
| Monolithic Power Systems Inc | 18.16 | 9.98 | 13.87 | 4.17% | $0.18 | $0.35 | 39.24% |
| STMicroelectronics NV | 23.97 | 1.42 | 2.15 | 0.32% | $0.51 | $0.84 | -27.36% |
| ASE Technology Holding Co Ltd | 19.08 | 2.01 | 1.04 | 2.39% | $27.16 | $24.89 | 11.56% |
| ON Semiconductor Corp | 34.40 | 2.58 | 3.19 | -5.78% | $-0.37 | $0.29 | -22.39% |
| United Microelectronics Corp | 12.09 | 1.45 | 2.37 | 2.06% | $23.86 | $15.45 | 5.91% |
| First Solar Inc | 13.93 | 2.15 | 4.14 | 2.59% | $0.35 | $0.34 | 6.35% |
| Credo Technology Group Holding Ltd | 251.72 | 18.19 | 30.28 | 5.63% | $0.03 | $0.09 | 25.94% |
| Skyworks Solutions Inc | 27.65 | 1.79 | 2.88 | 1.11% | $0.22 | $0.39 | -8.87% |
| Qorvo Inc | 134.62 | 2.14 | 2 | 0.93% | $0.11 | $0.37 | -7.6% |
| Universal Display Corp | 31.04 | 4.28 | 10.97 | 3.93% | $0.08 | $0.13 | 0.62% |
| Lattice Semiconductor Corp | 126.89 | 9.12 | 13.28 | 0.71% | $0.02 | $0.08 | -14.68% |
| Average | 63.46 | 6.57 | 9.95 | 3.21% | $35.9 | $29.72 | 12.28% |
By analyzing NVIDIA, we can infer the following trends:
With a Price to Earnings ratio of 45.16, which is 0.71x less than the industry average, the stock shows potential for growth at a reasonable price, making it an interesting consideration for market participants.
The elevated Price to Book ratio of 40.72 relative to the industry average by 6.2x suggests company might be overvalued based on its book value.
With a relatively high Price to Sales ratio of 23.31, which is 2.34x the industry average, the stock might be considered overvalued based on sales performance.
The company has a higher Return on Equity (ROE) of 23.01%, which is 19.8% above the industry average. This suggests efficient use of equity to generate profits and demonstrates profitability and growth potential.
The company has lower Earnings Before Interest, Taxes, Depreciation, and Amortization (EBITDA) of $22.58 Billion, which is 0.63x below the industry average. This potentially indicates lower profitability or financial challenges.
The company has lower gross profit of $26.67 Billion, which indicates 0.9x below the industry average. This potentially indicates lower revenue after accounting for production costs.
The company's revenue growth of 69.18% exceeds the industry average of 12.28%, indicating strong sales performance and market outperformance.
Debt To Equity Ratio
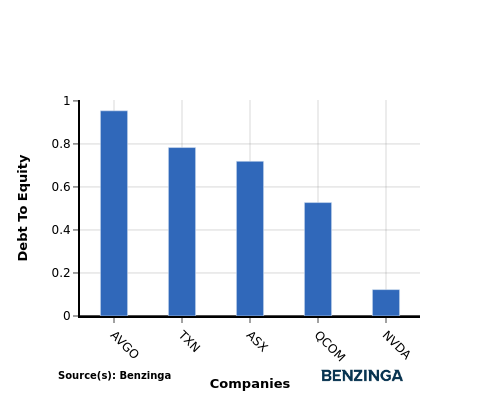
The debt-to-equity (D/E) ratio is an important measure to assess the financial structure and risk profile of a company.
Considering the debt-to-equity ratio in industry comparisons allows for a concise evaluation of a company's financial health and risk profile, aiding in informed decision-making.
When assessing NVIDIA against its top 4 peers using the Debt-to-Equity ratio, the following comparisons can be made:
NVIDIA has a stronger financial position compared to its top 4 peers, as evidenced by its lower debt-to-equity ratio of 0.12.
This suggests that the company has a more favorable balance between debt and equity, which can be perceived as a positive indicator by investors.
Key Takeaways
For NVIDIA, the PE ratio is low compared to peers, indicating potential undervaluation. The high PB and PS ratios suggest strong market sentiment and revenue multiples. The high ROE reflects efficient use of shareholder equity, while low EBITDA and gross profit may indicate operational challenges. The high revenue growth rate signals strong sales performance relative to industry peers in the Semiconductors & Semiconductor Equipment sector.
This article was generated by Benzinga's automated content engine and reviewed by an editor.